View this report

Summary
- National health statistics compiled on alcohol-related causes of death or admissions to hospitals follow the World Health Organisation International Statistical Classification of Diseases and Related Health Problems
- In the UK, alcohol-related mortality is estimated according to ‘specific’ or ‘underlying’, and ‘contributory’ factors
- Alcohol-related hospital admissions are based on a methodology which uses indicators for alcohol-related illnesses* to determine what proportion of cases of a health condition are alcohol-related, known as alcohol-attributable fractions
Introduction
Within the United Kingdom, data on alcohol-related mortality and morbidity are compiled by the health statistics divisions of separate agencies for England, Wales, Scotland, and Northern Ireland. The Office of National Statistics (ONS) holds data on alcohol mortality and morbidity rates for England and Wales, as do the Information Services Division (ISD) for Scotland and the Northern Ireland Statistics and Research Agency (NISRA) for Northern Ireland.
All national health statistics compiled on alcohol-related causes of death or admissions to hospitals follow the World Health Organisation (WHO) International Statistical Classification of Diseases and Related Health Problems. The most recent system of categorisation – the 10th revision (ICD-10) – was endorsed by the 43rd World Health Assembly in May 1990 and came into use in WHO Member States from 1994 [1]. The 11th revision (ICD-11) was adopted by the 72nd World Health Assembly in May 2019 and comes into effect in 2022 [2].
All rates are also standardised according to the European Age Standardised Rate (EASR). The ISD defines this as follows:
Standardised rates are used to allow comparisons across geographical areas by controlling for differences in the age structure of local populations. Age standardised rates can be compared across areas and time periods. They give the number of events that would occur in a standard population (per 100,000) if that population had the age-specific rates of a given area. The rates are standardised to the European Standard Population (ESP). The age groups used for deriving the standardised rates are as defined in the ESP [3].
Alcohol-related mortality rates
In the UK, alcohol-related mortality is estimated according to ‘specific’ or ‘underlying’, and ‘contributory’ factors. The Office for National Statistics (ONS) uses the former in its calculations.
Underlying factors are defined as either the disease or injury which initiated the train of morbid events leading directly to death; or the circumstances of the accident or violence which produced the fatal injury [4]. However, these exclude deaths where an alcohol-related condition was recorded as a contributory factor; a contributory cause of death is a significant condition that contributes to the fatal outcome (ie where an alcohol-related condition is mentioned as an additional element to a fatal outcome by other means).
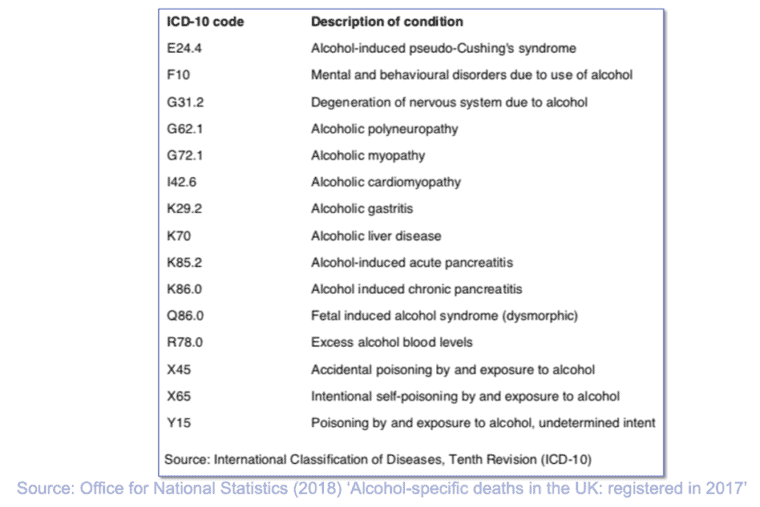
The ONS definition of alcohol-related deaths, is, in fact, alcohol-specific – it only includes wholly-attributable deaths, which are those causes regarded as being most directly due to alcohol consumption (eg all deaths from unspecified chronic hepatitis (ICD-10 code, K73) and fibrosis and cirrhosis of the liver (ICD-10 code, K74, excluding biliary cirrhosis)), even when alcohol is not specifically mentioned on the death certificate.
Figure 1 The National Statistics definition of alcohol-specific deaths

The ONS definition of alcohol-specific deaths does not include diseases where there is evidence showing that only a proportion of the deaths, for a given cause, are caused by alcohol (that is, partially-attributable deaths), such as cancers of the mouth, oesophagus and liver. Apart from deaths due to poisoning with alcohol (accidental, intentional or undetermined), this definition also excludes any other external causes of death, such as road traffic and other accidents [5].
A broader definition of an alcohol-related death includes both underlying and contributory causes. Mortality statistics under the title ‘any mention’ combine these factors. Public health agencies, such as Public Health England, have developed separate measures that take into account these additional causes and use these in addition to the alcohol-specific deaths measure [6].
Alcohol-related morbidity rates
The number of alcohol-related hospital admissions in England is based on the methodology devised by the Centre for Public Health (CPH, then known as the North West Public Health Observatory), which uses indicators for alcohol-related illnesses* to determine what proportion of cases of a health condition are alcohol-related. These are known as alcohol-attributable fractions (AAFs).
AAFs were calculated for 47 conditions where a causal relationship with alcohol consumption has been established, of which 13 were by definition directly or wholly attributable to alcohol consumption (AAF = 1) and 34 were partially attributable to alcohol consumption (0 < AAF < 1) [7]. Local Alcohol Profiles England (LAPE) provides the full list of conditions attributable to alcohol-related deaths and illnesses/injuries, along with their AAFs, based on the ICD-10 codes.
For each episode of care in hospital, clinicians record the primary diagnosis and up to 19 secondary diagnoses. Where an episode involves more than one alcohol-related diagnosis, the highest AAF within the record is used as the estimate of the overall alcohol-attributable fraction for that episode. The primary diagnosis is defined in the NHS Data Dictionary as ‘the main condition treated or investigated during the relevant episode of healthcare, and where there is no definitive diagnosis, the main symptom, abnormal findings or problem’ [8]. All subsequent conditions discovered in the patient during their episode are recorded as secondary.
Where there are two or more codes with the maximum attributable fraction, the code from the earliest position is used. This method is employed to avoid double counting of the admission episodes related to alcohol and therefore each episode contributes to one cell in the table. The total number of alcohol-related admissions is arrived at by summing up the number of episodes counted against each alcohol-related condition [9].**
Clinicians in Wales calculate the number of alcohol-related admissions based on the CPH method of AAFs from a set of 14 diagnoses (one primary plus 13 secondary). Both the Health & Social Care Information Centre (HSCIC) in England and the Public Health Wales Observatory (PHWO) use these methods to produce two separate figures on alcohol-related hospital admissions:
- A broad measure, which is derived by summing the AAF associated with each admission based on the diagnosis most strongly associated with alcohol out of all diagnoses (both primary and secondary)
- A narrow measure, which is constructed in a similar way but counts only the fraction associated with the diagnosis in the primary position
Scottish statistics on alcohol morbidity rates are produced differently, on two counts. Firstly, the registration of alcohol-related hospital episodes is derived from a list of 26 conditions based on the ICD-10 coding system [10]. Secondly, for each episode of care in hospital, clinicians record the primary diagnosis and up to five supplementary diagnoses on discharge, based on recording ICD-10 codes ‘directly attributable to alcohol’ [11].
A further distinction between the English and Scottish counting methods is that the information presented on General Acute and Psychiatric inpatient and day case hospital stays relates to the time of discharge rather than admission. The reason for this is that as ‘diagnostic information usually becomes available during the course of a hospital stay, the use of discharge data provides a more complete and accurate picture of a patient’s condition(s)’ [12]. NISRA’s calculations of alcohol-related morbidity rates follows the Scottish method [13].
In 2008, a CPH (formerly NWPHO) report identified limitations in the methods used to calculate mortality and morbidity rates. For instance, the over-reliance on the accuracy of population estimates of alcohol consumption, deemed to have ‘a degree of uncertainty’ in their formulation. A further limitation of the methodology noted the application of AAFs to hospital admissions, which required the assumption that the admission profile for an alcohol-related admission for a partially attributable condition is the same as the admission profile for a non-alcohol-related admission [14].
Another concern is that the data analysed only includes hospital admissions and not presentation to accident and emergency departments (unless they resulted in an admission) [15]. This suggests that there may be many more casualties resulting from alcohol which never reach the hospital and therefore go unrecorded. The long-term effect of such discrepancies in the methodology is the underestimation of the true impact of alcohol on mortality and morbidity rates.
In 2014, researchers at the CPH produced updated figures on the number of deaths and hospital admissions in 2010 occurring as a result of alcohol consumption, which discovered that – if only the harmful consequences are considered – over 21,000 deaths were caused by alcohol consumption, representing 5% of all deaths in England that year. In addition, over 900,000 admissions to hospital were related to the harmful consequences of alcohol use, around 6% of all admission episodes in England in that year [16]. The most recent dataset (for 2017) puts the number of deaths at approximately 24,200.***
Lead author of the report Lisa Jones commented: ‘This data and improvements in the methodology have allowed us to identify the full impact of alcohol on population health in England’. It also addressed several limitations in the methods used to previously calculate AAFs, one being the potential overestimation of injury risk associated with alcohol use due to the failure to account for drinking context in which alcohol is consumed, and another being the likely underestimation of consumption in the general population [17].
In a response to a consultation held by the CPH (formerly NWPHO) over the methods used to estimate alcohol-related hospital admissions for England, the IAS recommended that the methodology used to record data on alcohol-related hospital admissions be amended in order to produce a more robust estimate of the burden caused by alcohol that is comparable between regions and over time [18].
* Based on information on patients’ characteristics and diagnoses from the Hospital Episode Statistics (HES)
** The total number of alcohol-related hospital admissions, as described by the indicators, is not a number of actual people or a number of actual admissions but an estimated number of admissions calculated by adding up all of the fractions we have identified (see infographic:

*** Please visit the IAS Health impacts webpage for the most up-to-date LAPE figures on alcohol mortality.
- World Health Organisation (WHO), ‘International Classification of Diseases (ICD)‘
- World Health Organisation (WHO), ‘International Statistical Classification of Diseases and Related Health Problems (ICD)’
- Information Services Division (ISD) Scotland (May 2012), ‘Alcohol-related Hospital Statistics Scotland 2012, Publication Report‘, p. 11
- Health and Social Care Information Centre (HSCIC) (October 2010), ‘HOSPITAL EPISODE STATISTICS: Mortality Data Dictionary‘, p. 5
- Office for National Statistics (ONS) (February 2014), ‘Alcohol-related deaths in the United Kingdom, registered in 2012’
- ONS (December 2018), ‘Alcohol-related deaths in the United Kingdom, registered in 2017’
- NHS Digital (May 2012), ‘Statistics on Alcohol: England, 2012‘, p. 59
- NHS Data Model and Dictionary Service, ‘Primary Diagnosis‘
- HSCIC (May 2014), ‘Statistics on Alcohol – England, 2014’, p. 34
- ISD Scotland/NHS National Services Scotland (February 2011), ‘Alcohol Statistics Scotland 2011’, p. 103
- ISD Scotland/NHS National Services Scotland, pp. 96–7
- ISD Scotland/NHS National Services Scotland, p. 40
- HSC Public Health Agency (April 2011), ‘Health Intelligence Briefing: Alcohol use and alcohol-related harm in Northern Ireland’, p. 38
- Jones L, Bellis M, Dedman D, et al. (June 2008), ‘Alcohol-attributable fractions for England: alcohol-attributable mortality and hospital admissions‘, North West Public Health Observatory [NWPHO], Centre for Public Health Research Directorate, Liverpool John Moores University, Liverpool, p. 8
- Morleo M, Dedman D, O’Farrell I, et al (May 2010)., ‘Alcohol-attributable hospital admission: segmentation series report 3’, NWPHO, p. 7
- The Institute of Alcohol Studies (March 2014), ‘New Centre for Public Health report updates figures on the impact of alcohol on population health in England’
- Jones L, Bellis M (March 2014)., ‘Updating England-Specific Alcohol-Attributable Fractions’, Centre for Public Health Liverpool John Moores University p. 31
- Institute of Alcohol Studies (August 2012), ‘IAS response to NWPHO consultation on the methods used to estimate alcohol-related hospital admissions for England’
View this report
