Two new datasets on the health effects of alcohol consumption in England reveal huge and growing disparities in drinkers’ outcomes, with older people and those living the north worst off.
Released today, both NHS Digital’s ‘Statistics on Alcohol England 2019’ and Public Health England’s ‘Local Alcohol Profiles for England (LAPE): February 2019 update’ found that while overall levels of morbidity and mortality remained largely flat, the geography and demography of alcohol-related harms fall disproportionately on certain groups.
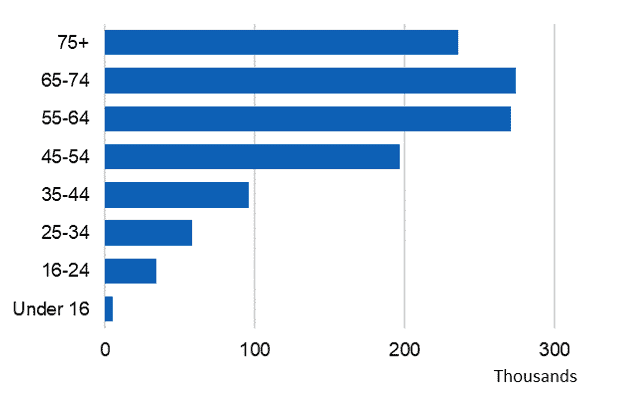
In 2017/18, there were 1.2 million estimated admissions where the primary reason was linked to alcohol in England (broad measure), a slight increase on 2016/17 (3%), yet four out of every five (83%) of patients was aged over 45 years (illustrated).

By the broad measure, the vast majority of patients were over the age of 45 years (69%) |
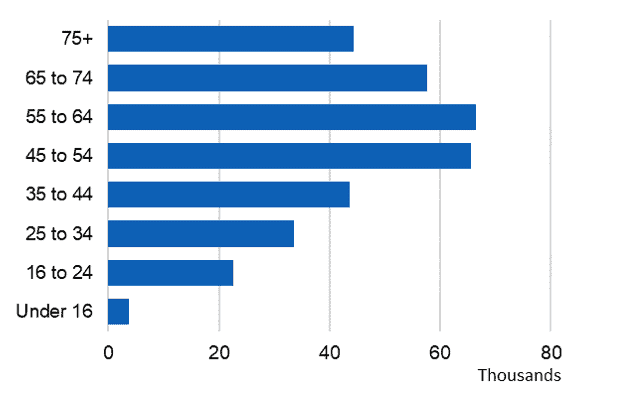
As for the narrow measure, there were 337,900 admissions where the main reason for admission was attributed to alcohol – also slightly higher than last year (337,110) – yet when split by age, NHS Digital observed that ‘the number of admissions rises with age up until 55-64 and then falls’ (illustrated below).

By the narrow measure, the vast majority of patients were over the age of 45 years (83%) |
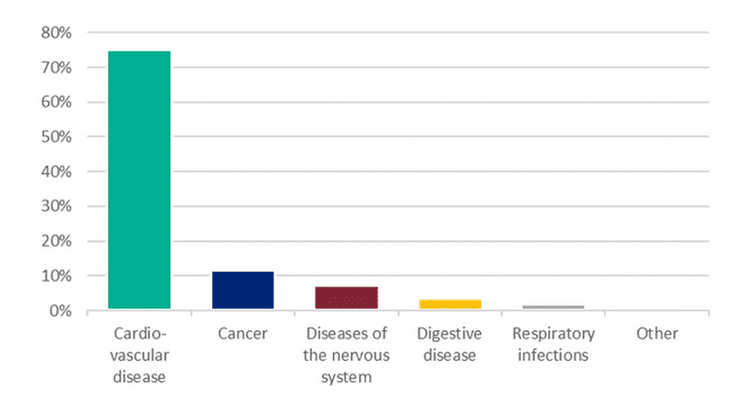
69% of patients were aged over 45. LAPE data showed that the majority of admissions were for cardiovascular disease (52%), and a sizeable proportion (17%) were for mental and behavioural disorders due to alcohol (illustrated).

Most alcohol-related hospital admissions of chronic conditions partly but not wholly caused by alcohol were for cardiovascular diseases (605,000 admissions) |
Alcohol mortality figures told a similar story. A 6% increase in alcohol-specific deaths (from 5,507 in 2016 to 5,843 in 2017) masked the fact that split by age, the number of deaths in every age cohort increases up to 50–59 years of age before falling. 78% of deaths were in the age range 40-69. Almost a quarter of admissions were for cancer and 23% were for unintentional injuries.
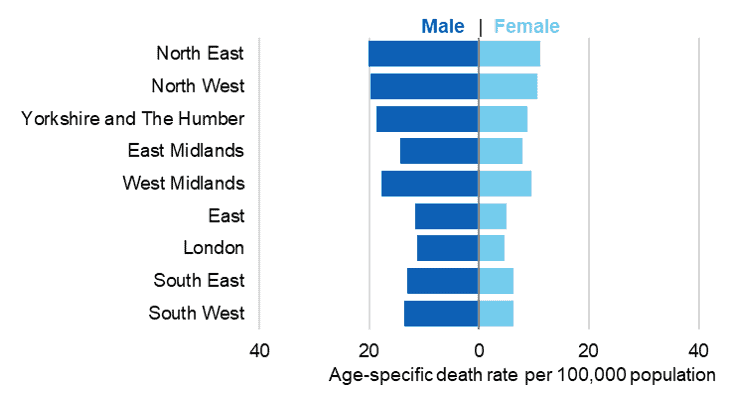
Furthermore, when split by region, age-standardised death rates were highest in the north and lowest in London and the south (illustrated). A similar north/south divide emerges for hospital admissions – NHS Digital found that Blackpool and Salford (in the north west of England) had the highest alcohol admissions rates, whereas Wokingham (in the south east) had the lowest rates.

The north east has the highest death rates in the country for both sexes |
Older drinkers were also most likely to drink at increased or higher risk of harm; that is, over 14 units of alcohol in the last week – Split by age, both men and women 55–64 years of age were most likely to do so in 2017 (36% and 20% respectively). This statistic is set against a backdrop of a falling proportion of increased or higher risk drinkers between 2011 and 2017. 55-64 year-olds were also most likely to drink in the last week (72% and 63% respectively), and those aged 50–74 years of age spent the most on alcohol in England, with 65–74 year-olds splashing out £10.60 per week in 2017, £1.90 above the national average weekly spend of £8.70. In terms of affordability, Stats on Alcohol England found that beverages are becoming ever more affordable – in 2018 alcoholic drinks were 64% more affordable than they were in 1987.
There was a typically positive correlation between alcohol-specific death rates and areas of deprivation for both sexes – the more deprived an area, the higher the (alcohol-related) mortality rate. Yet, the proportion of adults usually drinking at increased or higher risk of harm was highest in higher income households – this suggests that higher levels of alcohol harm in poorer households is down to several factors, not consumption levels alone.
Commenting on the figures, chair of the Alcohol Health Alliance, Professor Sir Ian Gilmore said:
‘These figures send a strong message to the Government that an evidence-based approach to tackling alcohol harm is long overdue if they are truly committed to tackling health inequalities.’
