View this report
Summary
- The office for National Statistics has measured alcohol consumption levels in the UK for over 40 years, by a series of surveys
- However, official figures calculated do not take into account the levels of unrecorded alcohol consumed – survey data are prone to the phenomenon of underreporting
- Sales data – calculated from the receipts of alcohol purchased from retailers – offer a more ‘robust’ means for monitoring population levels of alcohol consumption’
- An alternative to survey data on alcohol consumption is sales data. Sales data are calculated from the receipts of alcohol purchased from retailers
- Like alcohol sales data, alcohol taxation data collected by HMRC can also be seen as more robust than survey data, although also subject to their own biases and limitations
- It can be assumed in all instances that official statistics on the consumption of alcohol are conservative estimates
Introduction
Data on alcohol consumption is usually calculated by the self-reported drinking habits of randomly selected respondents in surveys, or by collated receipts of alcoholic beverages sold by retailers. This paper describes (and examines the relative merits of weaknesses of) how both approaches are used by statistical agencies, since it is likely that both surveys and receipts provide conservative estimates of the true level of consumption.
Survey data
Opinions & Lifestyles surveys (OPN) – a randomised sample omnibus survey run monthly by the Office for National Statistics (ONS) – ran the most comprehensive collection of alcohol consumption data for Great Britain between 2012 and 2018, following on from the series of releases from the General Household Survey (GHS) and General Lifestyle Survey (GLF), both of which have monitored the adults’ drinking behaviours for over 30 years (see figure 1) [1].
Figure 1 Timeline of alcohol consumption surveys
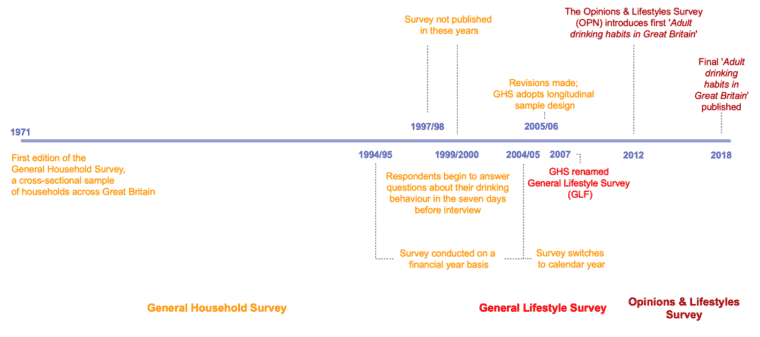
Since 1998, respondents have answered questions about their drinking behaviour in the seven days before interview – specifically, in the OPN’s case, how many days they drank alcohol during the previous week.
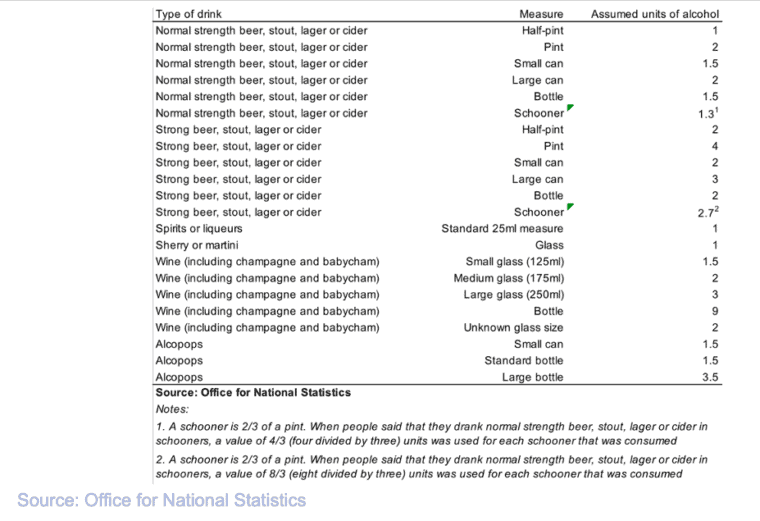
They are also asked how much of each of six different types of drink (normal strength beer; strong beer; wine; spirits; fortified wines; and alcopops) they drank on their heaviest drinking day during the previous week. These amounts are converted to units of alcohol and summed to give an estimate of the number of units the respondent consumed on their heaviest drinking day [2].
Continuity and change
Despite changes to household sampling selection and a reduction in the number and detail of questions migrated from the GLF to the OPN, the Office for National Statistics considered the volume of data amassed and processed to be broadly comparable between both surveys; approximately 13,000 adults are interviewed per year [3].
This contrasts with the changes between the GLF and the GHS. From 1994/95 to 2004/05 the GHS was conducted on a financial year basis, with fieldwork spread evenly across the year April to March. However, in 2005 the survey period reverted to a calendar year and the whole of the annual sample (which was increased to 16,560) analysed the nine months from April to December 2005. All subsequent surveys run the full calendar year.
Since the 2005 survey did not cover the January to March quarter, this affected annual estimates for topics which are subject to seasonal variation. To rectify this, where the questions were the same in 2005 as in 2004/05, the final quarter of the 2004/05 survey was added (weighted in the correct proportion) to the nine months of the 2005 survey [4].
Another change in 2005 was that, in line with European requirements, the GHS adopted a longitudinal sample design, in which people remain in the sample for four years (waves) with one-quarter of them replaced on an annual basis. By tracking the same cohort of respondents for a longer period of time, the GHS was better able to detect ‘statistically significant estimates of change over time’, compared with the previous cross-sectional design, in which every annual sample produces results that cannot be safely said to positively correlate with the previous year’s [5].
In 2006, the ONS made two further amendments in its methodology in order to better reflect assumptions in people’s drinking habits. Firstly, the number of units for “normal strength beer, stout, lager, or cider”, “strong beer, stout, lager or cider” and “wine” categories changed; in the case of wine in particular, the alcohol by volume (ABV) content underwent a marked increase in average strength from 9% to 12%. The 2005 estimates produced in subsequent reports were recalculated to reflect the same alcohol content assumptions as later ones. Secondly, the methodology for estimating the nation’s wine consumption expanded to account for a variety of glass sizes: small (125 millilitres); medium (175 millilitres); and large (250 millilitres). Previously, it was assumed that 175 millilitres glasses had been used. These changes were adopted in their entirety into the new General Lifestyle Survey (GLF) in 2008. Figure 2 displays the assumed content of drinks and measures collected in the OPN surveys.
Figure 2 Assumed alcohol content of drinks and measures collected on the Opinions and Lifestyle Survey
The GLF became the OPN from 2012, due to ‘the need to deliver improved efficiency of data collection through greater harmonisation between poverty indicators used by the UK and EU, which are currently collected on separate surveys and cost savings as a result of the 2010 Government spending review’ [6].
Adult drinking habits in Great Britain: 2017, released in May 2018, is the final release of the OPN series. The Office for National Statistics decided to close the survey for the following reasons [7]:
- Our current questions on alcohol consumption are outdated
Our data, which measure alcohol consumption on the heaviest drinking day, do not reflect the latest government guidelines, which are focused on drinking habits over several days.
- The data are not being used to support government policy
Discussions with key government users have revealed that the Opinions and Lifestyle Survey (OPN) data were not an important source of evidence for policymakers, with users preferring to use data from other sources such as the Health Survey for England and devolved health surveys.
- We are unable to justify the cost for redesign or future running costs
The data described in this release were collected as part of a face-to-face interview on the OPN. As part of an ONS Data Collection Transformation programme, the OPN is due to be redeveloped. Given that our data are not being used to support government policy and alternative data sources are readily available, we are unable to justify the investment that would be needed to modernise and redevelop our alcohol consumption questions.
- Data on alcohol consumption are readily available elsewhere
To improve coherence for users, government producers of health statistics have been encouraged to reduce competing estimates.
Today, the responsibility for data collection of people’s drinking habits rests with the national statistical agencies of England (Health Survey for England by NHS Digital), Wales (National Survey for Wales commissioned by the Welsh Government), Scotland (Scottish Health Survey commissioned by the Scottish Government) and Northern Ireland (Health Survey Northern Ireland commissioned by the Department of Health).
As of 2018, Public Health England is looking at survey questions and outputs designed to measure alcohol consumption from the major government surveys, with a view to harmonisation of alcohol statistics across all agencies.
Unrecorded alcohol consumption
It is important to note that the official figures do not take into account the levels of unrecorded alcohol consumed. For instance, the National Audit Office (NAO) estimates that the tax gap for beer duty accounted for up to 14% of the UK market in 2009-2010 [8].
The World Health Organization (WHO) describes unrecorded alcohol as:
… alcohol that is not taxed and is outside the usual system of governmental control, because it is produced, distributed and sold outside formal channels. Unrecorded alcohol consumption… includes consumption of homemade or informally produced alcohol (legal or illegal), smuggled alcohol, alcohol intended for industrial or medical uses, alcohol obtained through cross-border shopping (which is recorded in a different jurisdiction), as well as consumption of alcohol by tourists [9].
As a result, it is difficult to calculate the actual amount of alcohol consumed. The most recent WHO estimates believe UK unrecorded alcohol consumption to amount to approximately 1.2 litres per head for the population aged 15+ years [10].
Survey data are also prone to underestimate the amount of alcohol consumed per person. Public Health England report ‘The Public Health Burden of Alcohol and the Effectiveness and Cost-Effectiveness of Alcohol Control Policies: An evidence review’ states:
It is widely acknowledged that household surveys underestimate population level alcohol consumption with estimates suggesting they record between 55% and 60% of consumption compared with actual sales. Retrospective analysis reports the discrepancy to be 430 million units a week, equivalent to a bottle of wine per adult drinker per week [11].
Sales data
An alternative to survey data on alcohol consumption is sales data. Sales data are calculated from the receipts of alcohol purchased from retailers.
In contrast to survey data, sales data provide ‘the most robust means for monitoring population levels of alcohol consumption’ because they are based upon actual retail receipts rather than a perceived amount of alcohol drunk in the week(s) prior to a survey [12].
NHS Health Scotland uses alcohol sales data ‘to lead the evaluation of Scotland’s alcohol strategy through the Monitoring and Evaluating Scotland’s Alcohol Strategy (MESAS) programme’ [13].
MESAS reports analyse alcohol sales and price data produced by market research analysts Nielsen and Kantar Worldpanel (off-trade) and CGA Strategy (on-trade).
The volume of alcohol sold (litres) is provided across eight alcoholic drink categories: spirits, wine, beer, cider, ready to drink beverages (RTDs), perry, fortified wine and ‘other’. The volume of each drink category sold is then converted into pure alcohol volume using a category-specific percentage alcohol by volume (ABV). The ABV indicates the typical strength of drinks sold in a category and is provided by the data suppliers. Nielsen also provides data on the volume of alcohol sold on promotion by large, multiple retailers for each drink category.
Figure 3 Nielsen’s off-trade universe
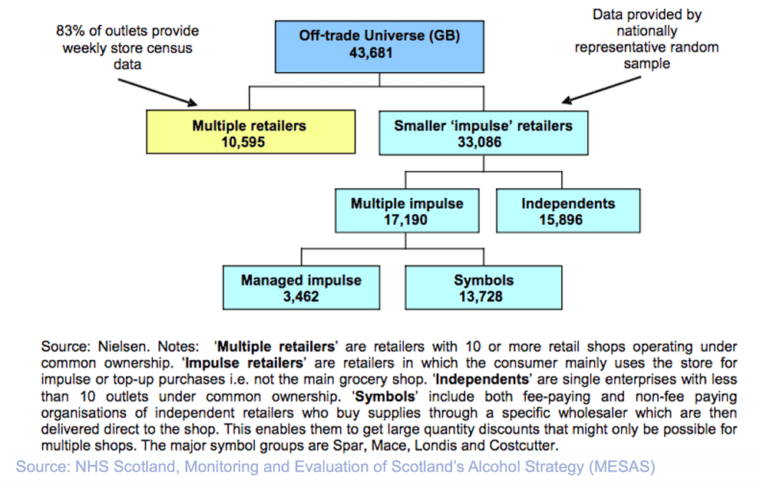
Per adult alcohol sales were calculated by dividing pure alcohol volumes (litres of pure alcohol) by the total population aged ≥16 years as calculated by the National Records of Scotland and the Office for National Statistics. Furthermore, by applying the volume of alcohol sold per adult in Scotland to the adult population of Northern Ireland, it can be crudely estimated that the Nielsen/CGA retail sales estimates account for approximately 95% of HM Revenue & Customs (HMRC) estimates for the UK as a whole (94% if data for England & Wales are applied to the Northern Ireland population) [14].
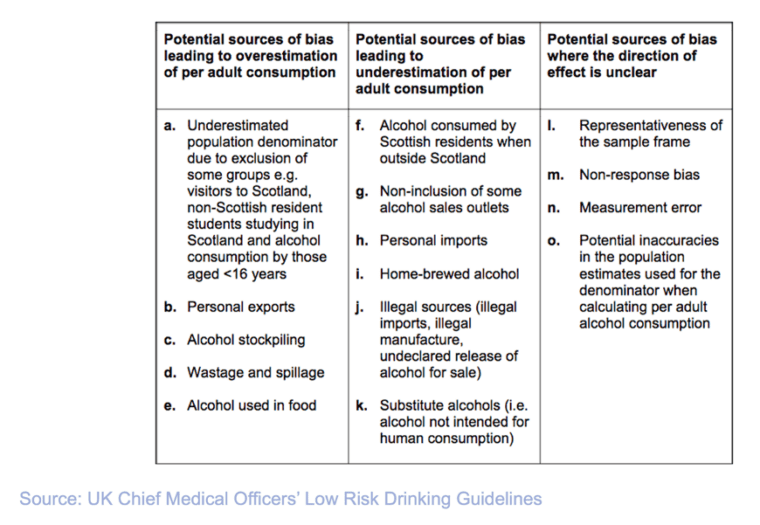
These techniques are employed to minimise the levels of underreporting identified by the Office for National Statistics and Public Health England. However, the figures produced remain estimates, and are therefore prone to some margin of error, no matter how small. NHS Health Scotland has identified 15 potential sources of bias in per adult estimation of alcohol consumption from retail sales data [15].
Figure 4 Potential sources of bias in per adult estimation of alcohol consumption from retail sales data
Taxation data
Like alcohol sales data, alcohol taxation data collected by HMRC can also be seen as more robust than self-reporting via surveys in that it shows the actual volume of alcohol bought and sold.
However, even these more objective and accurate measures to estimate alcohol consumption are subject to their own biases and limitations (see figure 4), and therefore not wholly representative of the nation’s drinking levels. The overall impact of these biases is such that actual population levels of consumption are likely to be underestimated [16].
Given these limitations, the ONS admits that:
Obtaining reliable information about drinking behaviour is difficult, and social surveys consistently record lower levels of consumption than would be expected from data on alcohol sales. This is partly because people may consciously or unconsciously underestimate how much alcohol they consume. Drinking at home is particularly likely to be underestimated because the quantities consumed are not measured and are likely to be larger than those dispensed in licensed premises [17].
If this is the case, then it can be assumed in all instances that official statistics on the consumption of alcohol are conservative estimates.
- Office for National Statistics (ONS) (Archived 2016), ‘The ONS Omnibus Service’
- ONS (December 2013), ‘Drinking Habits Amongst Adults, 2012’ Background notes, pp. 17–19
- ONS (December 2013), ‘Drinking Habits Amongst Adults, 2012’ Background notes, pp. 17–19
- ONS (2010), ‘General Lifestyle Survey 2008, Overview Report
- ONS (2010), ‘General Lifestyle Survey 2008, Overview Report
- ONS (February 2011), ‘The Future of the General Lifestyle Survey, p. 5
- ONS (May 2018), Discontinuation of this bulletin and alternative sources of data, in ‘Adult drinking habits in Great Britain: 2017’
- National Audit Office (NAO) (January 2012), ‘Renewed Alcohol Strategy: A Progress Report’, p. 4
- World Health Organization (WHO) (May 2014), ‘Global status report on alcohol and health 2014’, p. 5
- WHO, ‘Global status report on alcohol and health 2014’, p. 246
- Public Health England (December 2016), ‘The Public Health Burden of Alcohol and the Effectiveness and Cost-Effectiveness of Alcohol Control Policies: An evidence review’, pp.19–20
- Robinson M (March 2013), ‘A Review of the Validity and Reliability of Alcohol Retail Sales Data for Monitoring Population Levels of Alcohol Consumption: A Scottish Perspective’, Alcohol and Alcoholism
- NHS Health Scotland (March 2016), ‘MESAS final report – March 2016’
- NHS Health Scotland (2012), ‘Monitoring and Evaluating Scotland’s Alcohol Strategy: A review of the validity and reliability of alcohol retail sales data for the purpose of Monitoring and Evaluating Scotland’s Alcohol Strategy’, p. 31
- NHS Health Scotland (2012), ‘Monitoring and Evaluating Scotland’s Alcohol Strategy’, p. 9
- Robinson M (January 2015) ‘Regional alcohol consumption and alcohol-related mortality in Great Britain: novel insights using retail sales data’ BMC Public Health
- Office for National Statistics (ONS), ‘Chapter 2 – Drinking (General Lifestyle Survey Overview – a report on the 2011 General Lifestyle Survey)’
View this report
