Some things seem to be too good to be true.
The idea that life’s little pleasures – a glass of red wine, for example – might be good for us is seductive. Given that most public health advice is simultaneously common sense and mildly dispiriting – eat healthily, exercise, don’t smoke – the possibility that we don’t have to live like Spartans to live long and healthily lives is surely good news… But is that really the case?
J-shaped curves, and disentangling cause and effect
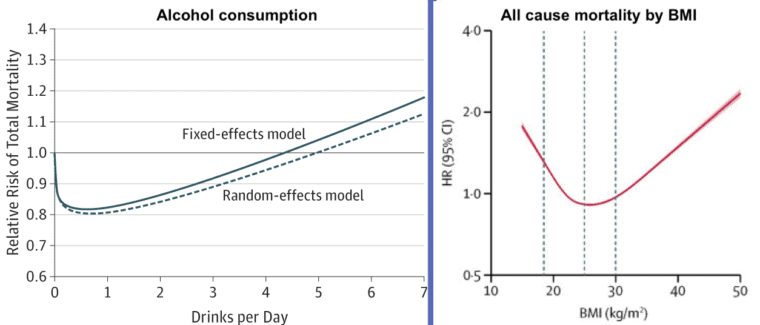
The observation that a small amount of something ostensibly unhealthy might be good for us is surprisingly ubiquitous in epidemiology. These so-called J-shaped relationships – where risk briefly decreases with increasing exposure, before increasing linearly – exist not only for alcohol consumption and mortality, but also for body mass index. And when interrogated using conventional methods these findings are surprisingly robust.

But the fact that a finding is robust does not necessarily mean that it’s true. In particular, it doesn’t necessarily mean that what we are seeing is a cause-and-effect relationship. And that is ultimately what we should be interested in. Does consuming a moderate amount of alcohol cause a reduction in mortality risk?
Much epidemiological research is concerned with cause-and-effect relationships, so that we can understand what risk factors actually cause the outcomes we wish to prevent or reduce. If we know that, we can develop individual- or population-level interventions that target the exposure. We know smoking causes several adverse health outcomes, and that has formed the basis of a range of public health interventions that have driven down smoking rates.
But identifying cause-and-effect relationships is notoriously difficult. An exposure might correlate with an outcome, but whilst this might imply the existence of a possible causal pathway, it doesn’t confirm it. Confounding – the bugbear of observational epidemiology, is nearly always present. Alcohol drinkers are different from non-drinkers in numerous ways, and those differences, rather than alcohol itself, may be causing the outcomes.
Even more difficult to deal with than conventional confounding is reverse causation, where a disease process changes the exposure, rather than the exposure causing the disease. For example, if your blood pressure is high, your doctor will strongly recommend that you drink less alcohol. Indeed, if you consult your GP for a wide range of health issues, reducing your drinking may be recommended.
We can adjust for these confounders and measures of health status statistically, but this will never be perfect. We are unlikely to ever account for all possible factors, and even if we did, we won’t have measured them perfectly. Unmeasured confounders, and measurement error in those that have been assessed, will mean that residual confounding will almost always be present to some degree.
Beyond statistical adjustment – Mendelian randomisation
Fortunately, there are a number of alternative approaches that don’t rely on statistical adjustment of data. One approach is to use the properties of genetic inheritance to create a natural experiment. Our genetic makeup is defined at conception – following Mendel’s first and second laws – this is random between siblings, and approximately random even at a population level.
This means that we can – in principle, and under certain assumptions – use our essentially randomised genetic predisposition to, for example, drink alcohol as a proxy for actually drinking alcohol. We can then use this genetic proxy – rather than whether or not we actually drink alcohol – to look at the effects of alcohol on a range of outcomes, in a manner roughly similar to a randomised trial, and protected from the usual problems of confounding.
This approach is referred to as Mendelian randomization(MR) and has been applied widely to study alcohol and health outcomes. Studies from East Asian countries have been particularly valuable, because in those populations there is a common genetic variant that leads to substantial differences in alcohol consumption.
Ethanol – the active component in alcoholic drinks – is metabolised to acetaldehyde, which, if it builds up, leads to unpleasant symptoms like facial flushing, headache and heart palpitations. This substance is broken down by an enzyme called acetaldehyde dehydrogenase (ALDH). In East Asian populations, individuals who carry two copies of the null form of the ALDH gene break down acetaldehyde very slowly, and therefore get unpleasant symptoms and very few such individuals drink alcohol to any extent.
What these studies tell us about alcohol
Given the random distribution of genetic variants this means that in the population there are groups that consume very different levels of alcohol on average, but do not differ in other ways. This form of “Nature’s randomized trial” clearly shows that greater alcohol consumption raises blood pressure and HDL cholesterol (which used to be thought of as protective of coronary heart disease and was known as “good cholesterol”, but which both MR studies and large scale randomised controlled trials – RCTs – show has no such protective effect – another example of confounding in epidemiological studies!).
The effects of alcohol on blood pressure and HDL cholesterol have been studied in RCTs, and the MR and RCT data closely align. RCTs are possible in this situation because you can change alcohol consumption for a short time among participants in RCTs. The agreement between MR and RCTs for outcomes like blood pressure and HDL cholesterol suggests the MR approach is working as it should be.
It has also been possible to carry out negative control studies. In some East Asian populations women hardly drink at all. That means genetic differences in ALDH in women won’t relate to alcohol consumption. And – sure enough – amongst women the genetic differences don’t relate to blood pressure or HDL cholesterol. If the genetic differences did influence these outcomes in women that couldn’t be due to alcohol itself, and must be due to other effects of the gene – known as “pleiotropic effects” in genetic parlance. But we don’t see that, so again we can be reassured that the MR approach is working.
However, it hasn’t been possible to do any large scale RCTs that alter alcohol consumption for many years to allow assessment of the effect on outcomes like coronary heart disease and cancer. Fortunately, MR studies exist.
The largest study of this kind has been carried out across 10 regions of China. Average drinking levels – for religious and other sociocultural reasons – differ very substantially across these regions, as well as between men and women within the regions as we’ve discussed. This means that MR studies can be conducted in groups who drink very different levels of alcohol. This allows for the shape of the relationship between alcohol consumption and health outcomes to be estimated.
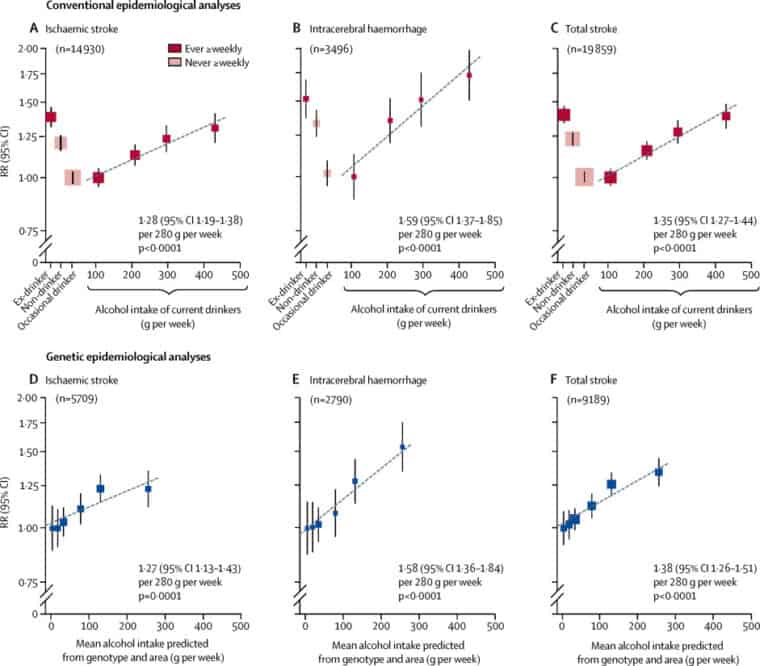
For hypertension and stroke, the relationship is such that risk increases steadily across the range, from low levels of alcohol consumption upwards. This result contrasts starkly with the finding from the observational data within the same study, which shows the same apparently – but spurious – protective effect of moderate alcohol consumption. The following graph clearly demonstrates this.

Millwood, Iona Y., et al. “Conventional and genetic evidence on alcohol and vascular disease aetiology: a prospective study of 500 000 men and women in China.” The Lancet 393.10183 (2019): 1831-1842.
What does all this mean?
The bottom line – unfortunately (for those of us who like an occasional drink) – is that it’s unlikely that low levels of alcohol consumption are beneficial to our health. If we want to improve our health, we should reduce our alcohol consumption. That doesn’t necessarily mean total abstinence – lower consumption means lower risk. But, unfortunately, it seems that a little bit of alcohol isn’t good for you after all.
Written by Professor Marcus Munafò and Professor George Davey Smith, MRC Integrative Epidemiology Unit, University of Bristol.
All IAS Blogposts are published with the permission of the author. The views expressed are solely the author’s own and do not necessarily represent the views of the Institute of Alcohol Studies.
